2026-01-26
How to Convert Any Source into a Beautiful Infographic
A step-by-step guide for educators to transform books, articles, and documents into visual learning materials using AI and open-source tools.

Why Infographics Matter in Education
Textbooks and articles are dense. Students scroll past walls of text. But infographics? Students stop and look.
Visual learning activates different parts of the brain—kids remember 80% of what they see, compared to just 10% of what they read. For educators, transforming your course materials into infographics isn't just nice to have; it's a game-changer.
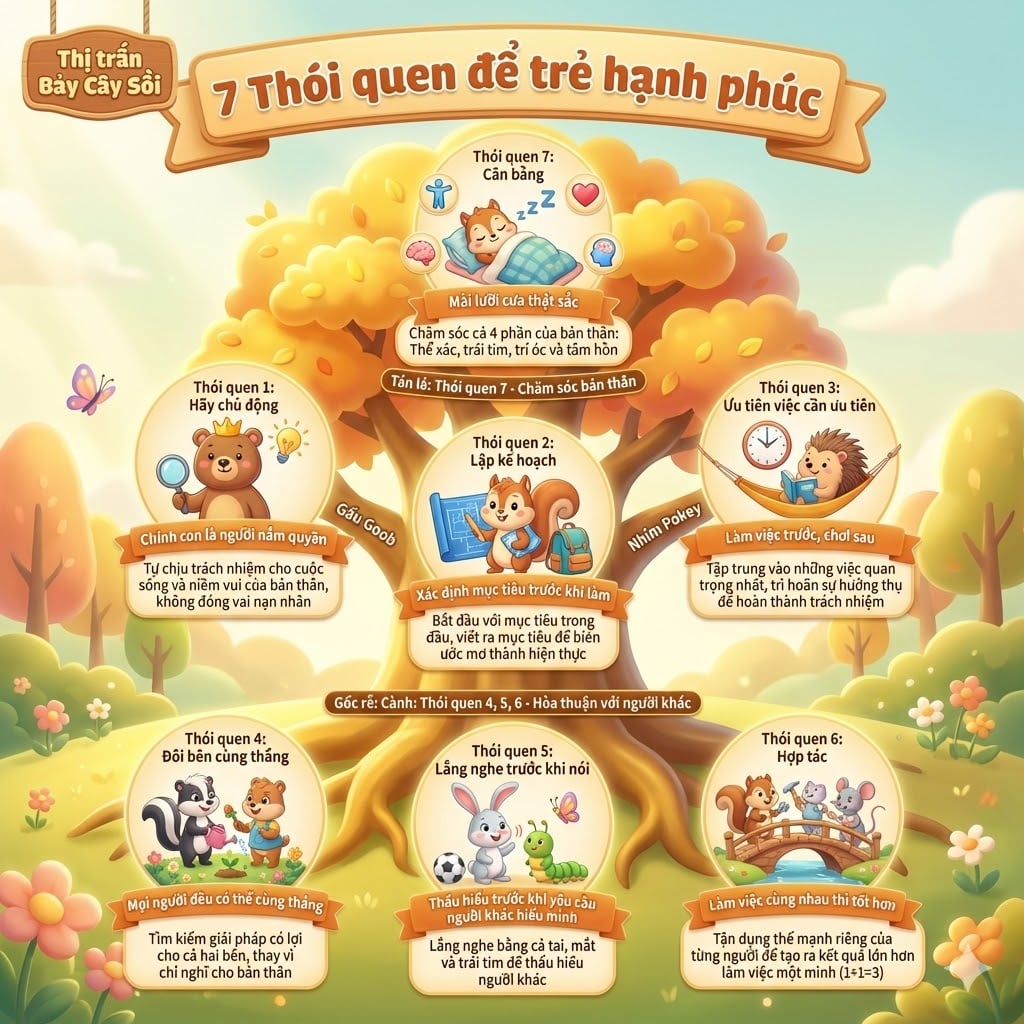
The challenge? Creating infographics from scratch takes design skills most teachers don't have. This guide shows you how I created a visual summary of "7 Habits for Happy Kids" in three simple steps—and how you can do the same with any source material.
The Three-Step Process
Step 1: Extract Structure with NotebookLM
What is NotebookLM? Google's NotebookLM is an AI research assistant that reads documents and helps you extract key information. For educators, it's perfect for analyzing books, articles, or any source material.
How to use it:
- Go to notebooklm.google.com
- Create a new notebook and upload your source:
- PDF files (textbooks, research papers)
- Google Docs or web links
- YouTube video transcripts
- Write a prompt to extract structure. Here's the Vietnamese prompt I used:
Bạn là một visual notetaker chuyên nghiệp. Hãy nghiên cứu tài liệu
và viết thành outline để làm sơ đồ tư duy tóm tắt tài liệu.
Trả kết quả về dạng Mermaid code.
English translation:
You are a professional visual notetaker. Study the document and
write an outline to create a mind map summarizing the content.
Return the result in Mermaid code format.
Why Mermaid? Mermaid is a simple, text-based diagramming language. AI can generate it easily, and it's open-source—perfect for educators on any budget.
Pro tip: Customize the prompt for your needs:
- For a course overview: "Create a hierarchical outline..."
- For student learning: "Simplify this for 6th graders..."
- For comparison: "Create a side-by-side comparison in Mermaid..."
Step 2: Refine the Structure (Optional)
The Mermaid code from NotebookLM is usually solid, but you can refine it:
- Remove unnecessary details
- Reorganize hierarchy
- Add key statistics or quotes
- Simplify technical jargon
Test it out with a free Mermaid viewer:
- mermaid.live - Paste your code and see it rendered
Step 3: Transform into a Visual Infographic
Here's where it gets beautiful: Use Google Gemini's image generation to turn your structured content into a professional infographic.
How to do it:
- Go to gemini.google.com
- Click "Create image" and describe what you want. Here's my prompt:
Create a beautiful, colorful infographic for children about
"7 Habits for Happy Kids" by Sean Covey.

Central tree with 7 habits as branches. Each habit shows:
- Character from the book
- Key message
- Simple description kids understand

Style: Warm, autumn colors, cute animal characters, friendly,
educational. Vietnamese text.
3. Gemini generates a draft → You can refine it:
- "More vibrant colors"
- "Add more animals"
- "Include emoji icons"
- "Simplify the text"
What I learned: The font challenge
When I first generated this infographic, Vietnamese diacritical marks (ả, ũ, ơ) appeared broken in some text. Here's how I fixed it:
- Added to my prompt: "Make sure Vietnamese fonts render correctly"
- In the final image, I manually checked text clarity
- Alternatively, use English labels and overlay Vietnamese translations
When to Use This Approach
✅ Perfect for:
- Book summaries and study guides
- Course outlines and lesson plans
- Concept explanations and frameworks
- Data visualization (statistics, timelines)
- Process flows (how-to guides)
❌ Not ideal for:
- Data requiring precise numerical accuracy (use Excel/Tableau)
- Highly technical diagrams (engineering, architecture)
- Real-time updating information
The Advantages for Educators
📚 Save Time: What takes 3-4 hours in Canva takes 15 minutes with this workflow 🎨 No Design Skills Needed: AI handles the aesthetics 📱 Instantly Shareable: Students love visual summaries—perfect for social media or class materials ♻️ Reusable: Generate variations for different grade levels or audiences 💰 Free: NotebookLM and Gemini are free to educators
Getting Started
- Pick a source you teach (a chapter, article, or concept)
- Go to NotebookLM and upload it
- Use the prompt to generate a Mermaid mind map
- Copy that structure into Gemini's image generator
- Refine until it's perfect
The first one will take 20 minutes. By your third infographic, you'll do it in 5.
Questions to Ask Yourself
- What material do my students find hardest to visualize?
- Which textbooks are just walls of text?
- What would my students understand better as a visual?
These are your first candidates.
Your turn: What's the next concept you want to turn into an infographic? Start with something simple—a chapter, a concept, a process—and watch how students engage differently with visual learning.